This post is part of the series WebGL 2 Development with PicoGL.js.
Welcome to our first lesson! As with any graphics tutorial, the first thing we need to do is get a triangle on the screen.
Environment
First a bit of set up. To get started we’ll need the following:
- A text editor.
- A recent version of Chrome or Firefox.
- The SpectorJS browser plugin for debugging. SpectorJS is an extremely powerful debugger that allows you to see all WebGL calls and all GL state that went into a given frame. For usage details, check out this tutorial.
- PicoGL.js (minified source).
- glMatrix (minified source). We’ll use this for the math in later parts of the series.
- A simple HTTP server. Some easy options are:
- Run
python -m http.serverif you have python 3 installed. - Run
python -m SimpleHTTPServerif you have python 2 installed. - Use nano-server if you have node.js installed.
- Run
Throw the two libraries into a directory on your machine, and create an HTML file named part1.html. Run your server and navigate to the correct URL to view the page (default is localhost:8000/part1.html for SimpleHTTPServer, localhost:5000/part1.html for nano-server). It’ll just be a blank page, but we’ll fix that shortly.
Add the following boilerplate code to the HTML file and save:
<!DOCTYPE html>
<html>
<head>
    <script src="picogl.min.js"></script>
    <script src="gl-matrix-min.js"></script>
</head>
<body>
    <canvas id="webgl-canvas"></canvas>
    <script type="shader/vertex" id="vertex-shader">
        #version 300 es

        void main() {

        }
    </script>
    <script type="shader/fragment" id="fragment-shader">
        #version 300 es
        precision highp float;

        void main() {

        }
    </script>
    <script>
        var canvas = document.getElementById("webgl-canvas");
        canvas.width = window.innerWidth;
        canvas.height = window.innerHeight;

        var gl = canvas.getContext("webgl2");

        var app = PicoGL.createApp(canvas)
        .clearColor(0, 0, 0, 1);
    </script>
</body>
This code is what we’ll start with for all of our examples, and it can be found here. All we’re doing is loading our two libraries, grabbing a handle to the canvas, and then making it fill the entire page. We also have no-op vertex and fragment shaders that we’ll fill in later.
PicoGL.js Setup
Now, we get to our first line of PicoGL.js code. Add the highlighted lines to the in-page script:
var canvas = document.getElementById("webgl-canvas");
canvas.width = window.innerWidth;
canvas.height = window.innerHeight;

var gl = canvas.getContext("webgl2");

var app = PicoGL.createApp(canvas)
.clearColor(0, 0, 0, 1);
The first thing we’re doing here is creating a PicoGL.js app, which manages all GL state for us. The second method sets the clear color for the app. Before drawing a frame, we’ll generally want to clear whatever was rendered on the previous frame. This sets the color we’ll use for clearing. It’s an RGBA value, with each channel having a range of [0.0, 1.0], so the color we’re setting here is solid black.
Just to make sure everything’s working properly, add the following line to the end of the script:
app.clear();
If everything’s working correctly, your canvas should be rendering solid black. If so, go ahead and remove that line.
Ok, now let’s actually draw something meaningful. PicoGL.js encapsulates a draw command in a draw call object. At a minimum, a draw call requires a program and a vertex array to function. Let’s look at those two pieces individually.
Create a Program
A program is the combination a vertex shader, to position geometry, and a fragment shader, to color pixels. These function similarly to their WebGL 1 counterparts, but in WebGL 2, we can use GLSL ES 3.00, which is much more powerful than GLSL ES 1.00. Fill in the vertex and fragment shaders as follows:
<script type="shader/vertex" id="vertex-shader">
    #version 300 es

    layout(location=0) in vec4 position;
    layout(location=1) in vec3 color;

    out vec3 vColor;
    void main() {
        vColor = color;
        gl_Position = position;
    }
</script>
<script type="shader/fragment" id="fragment-shader">
    #version 300 es
    precision highp float;

    in vec3 vColor;

    out vec4 fragColor;
    void main() {
        fragColor = vec4(vColor, 1.0);
    }
</script>
The vertex shader will pass the input position on as a clip position, and will pass the input color on to the rasterizer. The fragment shader simply renders the interpolated value of the input colors. Most of this should be familiar to those who have worked with WebGL 1 and GLSL ES 1.00. There are, however, a few important differences to note:
- GLSL ES 3.00 shaders must begin with directive
#version 300 es. attributevariables have been replaced byinvariables and can be given a specific location. This will later allow us to match them up to locations in vertex array objects.varyingvariables have been replaced byoutvariables in the vertex shader andinvariables in the fragment shader.- There is no longer a built-in
gl_FragColorvariable in the fragment shader. You have to declare the output yourself as anoutvariable. (Note that you can’t use the namegl_FragColor, since thegl_prefix is reserved in GLSL.)
With our shader code in place, we can create a program as follows:
// ... etc.
var app = PicoGL.createApp(canvas)
.clearColor(0, 0, 0, 1);

var vSource = document.getElementById("vertex-shader").text.trim();
var fSource = document.getElementById("fragment-shader").text.trim();
var program = app.createProgram(vSource, fSource);
Note that the trim() method here is important! GLSL 3.00 requires that the #version directive be on the first line, which isn’t the case for our script, since we have a newline after the opening script tag. We should now have a program that’s ready to be used for drawing. We just need to define an actual shape to draw. This is where vertex arrays come in.
Create a Vertex Array
The first thing we need to do is set up the vertex buffers we’ll use to store per-vertex attributes. Vertex buffers function essentially the same way they do in WebGL 1. The following code will create vertex buffers for our triangle’s vertex positions and colors:
// ... etc.
var program = app.createProgram(vSource, fSource);

var positions = app.createVertexBuffer(PicoGL.FLOAT, 2, new Float32Array([
     -0.5, -0.5,
     0.5, -0.5,
     0.0, 0.5
]));

var colors = app.createVertexBuffer(PicoGL.FLOAT, 3, new Float32Array([
     1.0, 0.0, 0.0,
     0.0, 1.0, 0.0,
     0.0, 0.0, 1.0
]));
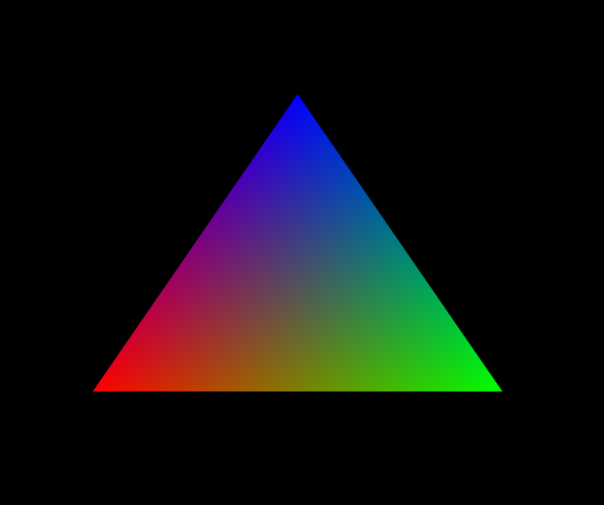
The first buffer stores the 2D coordinates of our triangle. The second stores the RGB values of the colors for each triangle vertex. This should all be quite familiar to those coming from WebGL 1. The next step is slightly different though, in which we’ll bundle our buffers into a vertex array:
// ... etc.
var positions = app.createVertexBuffer(PicoGL.FLOAT, 2, new Float32Array([
     -0.5, -0.5,
     0.5, -0.5,
     0.0, 0.5
]));

var colors = app.createVertexBuffer(PicoGL.FLOAT, 3, new Float32Array([
     1.0, 0.0, 0.0,
     0.0, 1.0, 0.0,
     0.0, 0.0, 1.0
]));

var triangleArray = app.createVertexArray()
.vertexAttributeBuffer(0, positions)
.vertexAttributeBuffer(1, colors);
Vertex arrays are a small but convenient addition to WebGL 2 that allow you to bundle the state of several attribute buffers and their pointers into a single vertex array object, then simply bind that vertex array, rather then having to set up the individual buffers and pointers for each draw call. Note that we’re passing indices to the vertexAttributeBuffer() calls. These indices connect the vertex buffers to the layout locations we gave our in variables in the vertex shader.
We’re now just about ready to…
Draw!
With our program and vertex array ready, we now have everything we need to create a draw call:
// ... etc.
var triangleArray = app.createVertexArray()
.vertexAttributeBuffer(0, positions)
.vertexAttributeBuffer(1, colors);

var drawCall = app.createDrawCall(program, triangleArray);
And finally, we can draw our triangle:
// ... etc.
var drawCall = app.createDrawCall(program, triangleArray);

app.clear();
drawCall.draw();
If everything went well, you should see the triangle at the top of this post rendering on your screen. A live version is available here. Congratulations on creating your first PicoGL.js app!
The completed source code for part 1 is available here. If you have any questions, feel free to post them in the comments, visit the PicoGL.js Gitter chat room, or look me up on Twitter.

3 thoughts on “WebGL 2 Development with PicoGL.js, Part 1: The Triangle”